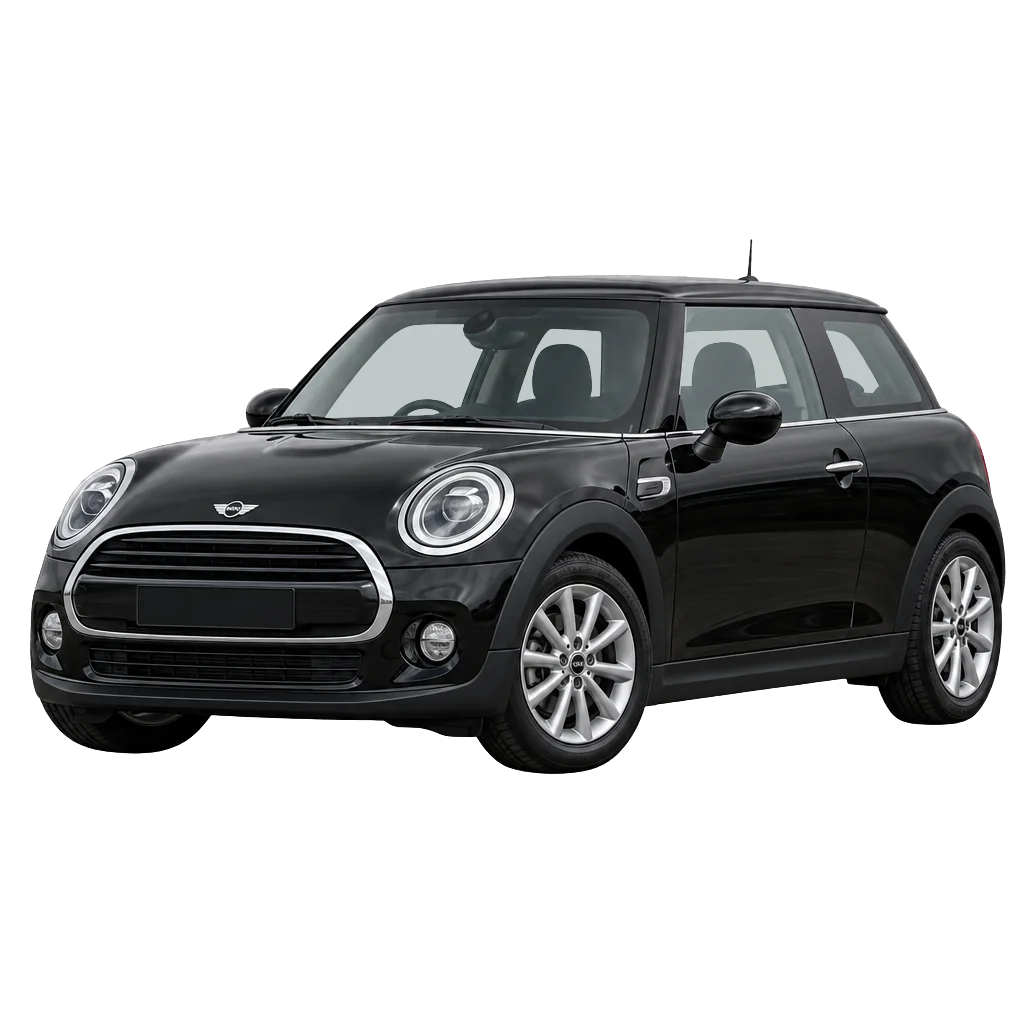
VehicleScore® has analysed 64 2016 MINI Cooper vehicles in this dataset. The figures below summarise VehicleScore® results, recorded mileage, MOT history and available emissions data for this model year.
2016 MINI Cooper (example)
See the lifespan for your MINI Cooper
Enter your registration to check real-world mileage.
Service history
Dealer & service records
MOT records
Past & current MOT data
Write-off check
Check for insurance write-offs
Finance check
Outstanding finance & theft checks
2016 MINI Cooper VehicleScore®
The median VehicleScore® among 64 2016 MINI Cooper vehicles analysed was 744 out of 999.
Median VehicleScore®
744
25th percentile
708
75th percentile
776
Vehicles with a score
64
Typical mileage for a 2016 MINI Cooper
The median mileage among 64 2016 MINI Cooper vehicles analysed by VehicleScore® was 66,129 miles.
Mileage is the latest recorded odometer reading stored for each vehicle. Earlier MOT readings are not counted as extra vehicles.
Median mileage
66,129 miles
25th percentile
42,152 miles
75th percentile
84,345 miles
Vehicles with mileage
64
2016 MINI Cooper MOT pass rate
VehicleScore® analysed 581 recognised pass/fail MOT tests across 64 2016 MINI Cooper vehicles.
MOT pass rate
85.9%
Valid pass/fail tests
581
Passes
499
Failures
82
All recorded MOT tests
581
Vehicles with MOT history
64
2016 MINI Cooper engines and emissions
Engine capacity
1,499 cc (63 vehicles)
Engine capacity
1,496 cc (1 vehicles)
Petrol
63
Diesel
1
Median CO2
109 g/km
CO2 25th percentile
105 g/km
CO2 75th percentile
111 g/km
Lowest CO2
92 g/km
Highest CO2
119 g/km
Vehicles with CO2
64
ULEZ compliant
100.0%
Vehicles with a ULEZ result
62
6b
62
How does the 2016 MINI Cooper compare?
Metric
2016 Cooper
All Cooper
VehicleScore®
744
810
Mileage
66,129 miles
58,424 miles
MOT pass rate
85.9%
84.0%
CO2
109 g/km
122 g/km
ULEZ
100.0%
100.0%
The median VehicleScore® in the 2016 sample was 744, compared with 810 in the wider MINI Cooper sample.
The median mileage in the 2016 sample was 66,129 miles, compared with 58,424 miles in the wider MINI Cooper sample.
The MOT pass rate in the 2016 sample was 85.9%, compared with 84.0% in the wider MINI Cooper sample.
The median CO2 in the 2016 sample was 109 g/km, compared with 122 g/km in the wider MINI Cooper sample.
ULEZ compliance in the 2016 sample was 100.0%, compared with 100.0% in the wider MINI Cooper sample.
Enter the registration to check the exact vehicle.
Statistics come from vehicles analysed through VehicleScore®. Counts use unique vehicles, so repeated searches do not change the figures. MOT tests are stored once. The MOT pass rate uses only recognised pass and fail results. Sample sizes vary by metric. This dataset does not represent every vehicle on UK roads.